Simplest Notion Business System for Scaling Companies
TL;DR: A 13-database Notion system handles sales, project delivery, task management, finances, OKRs, and HR for scaling service businesses. The core principle is automating task creation when project statuses change, with SOPs attached to each task so team members know exactly what to do without asking the founder.
Key Takeaways
- Systems make companies future-proof and founder-free. Without them, every new client increases chaos and complexity proportionally.
- The entire business system runs on just 13 databases, separated by department for clean permissions management as you hire.
- When a lead converts to a client, automations log the conversion date and create a client project automatically, keeping the pipeline seamless.
- Automated task creation tied to project status changes, with SOPs attached, means team members receive assignments with full instructions and no manual delegation needed.
- Team workload views give founders complete oversight of who is working on what, enabling smart task assignment without micromanaging.
Since 2020, I've helped more than 70 businesses streamline their operations using Notion.
Most of them had the exact same set of problems.
They were drowning in operational chaos, spending way too much time hunting for information, and basically trapped inside every single task because nothing ran without them.
So I want to share the simplest business system I've built that provides maximum return.
Bear in mind, this isn't about building some complex contraption that looks impressive but breaks the moment someone uses it wrong.
This is about systems that actually work when your business grows.
Why Systems Make Companies Future-Proof and Founder-Free
Let me show you something with a simple comparison.
On one side, you have a human team without systems.
On the other side, you have a systems-powered company.
When your company keeps growing, the operational volume increases.
More clients, more admin tasks, more cost and complexity.
Without systems, you get trapped. Every new client means more chaos, more things breaking, more fires for you to put out.
But with systems, something interesting happens.
The volume and scale of your company doesn't create an equal increase in cost and complexity.
Of course, in the beginning there's higher cost because you have to invest time building these systems.
But once they're built, you can scale freely without worrying that complexity will crush your operations.
I like to say that systems make companies future-proof and founder-free.
Here's something I've noticed across my clients who've already scaled.
Companies without systems or with messy operations have much higher team turnover.
People don't want to work in chaotic environments where they can't find anything and nobody knows what's happening.
They stay for three or four months, then leave for a company that has their operations sorted.
So honestly, systems aren't just about efficiency.
They're about building a place people actually want to work.
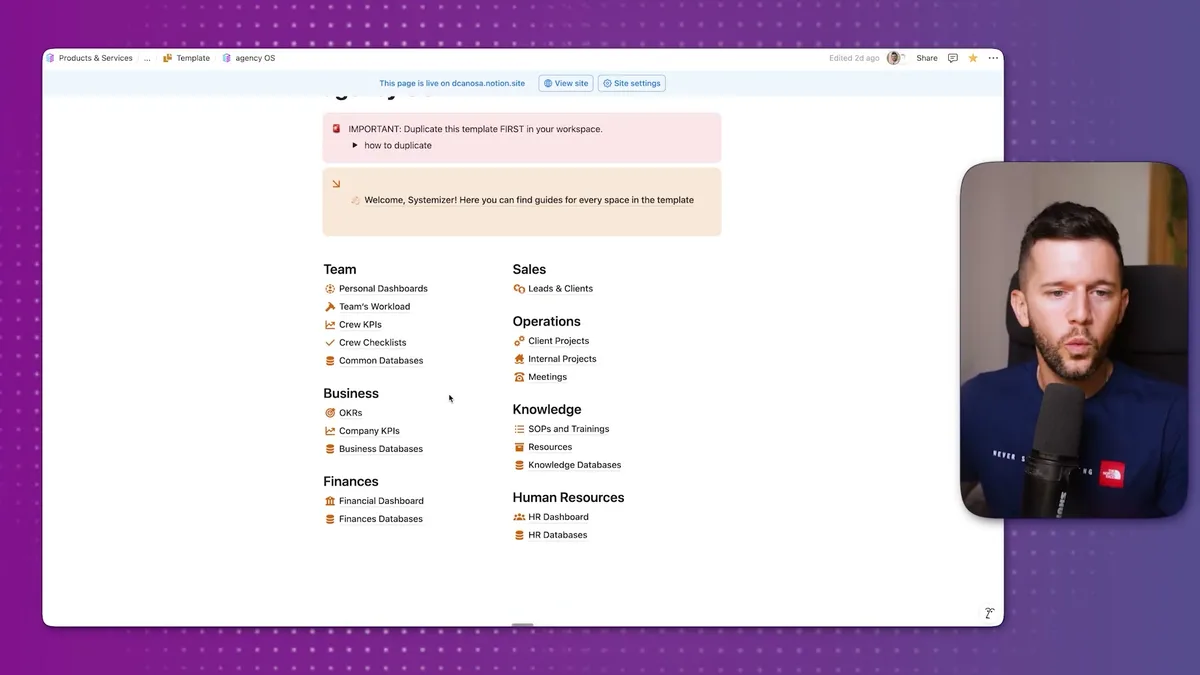
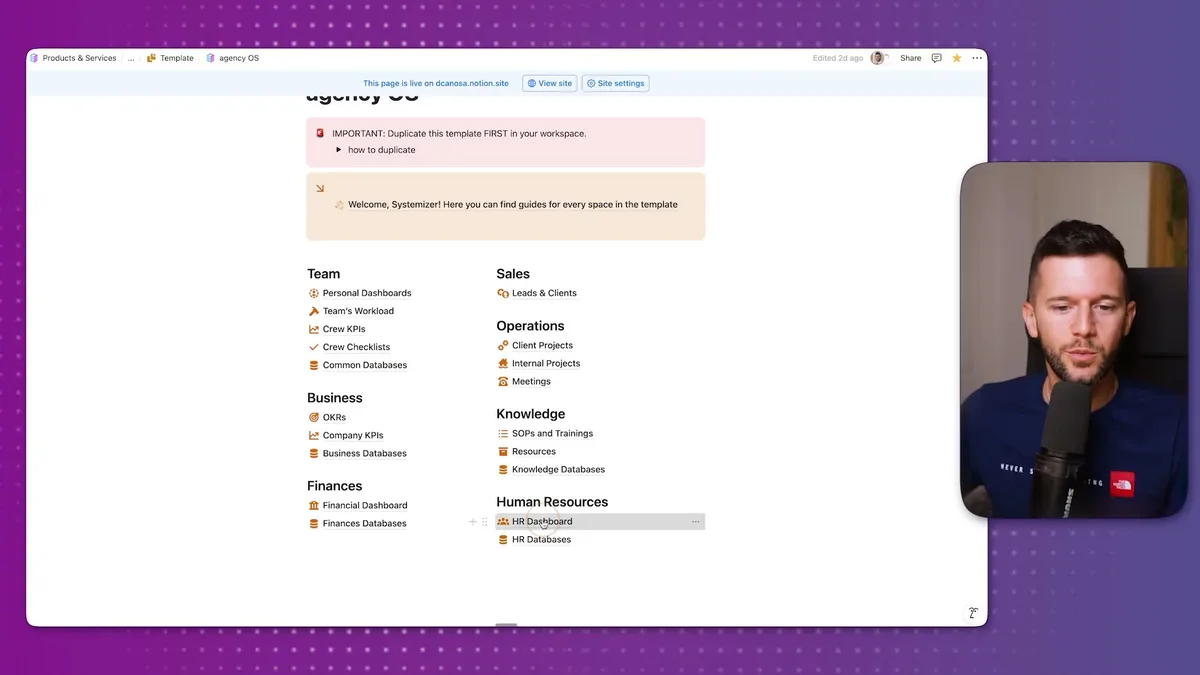
This is the main page of the system I'm about to walk you through.
The whole thing runs on just 13 databases.
Three years ago, I was using 18 databases and thought that was simple.
I was able to simplify it even more because I learned what actually matters in day-to-day operations.
Here's how the data is organized.
I separate every team of the company with these headings.
Within each heading, we have a databases page.
I group databases by department because maybe when we hire an HR manager, we only want them to have access to HR databases.
This makes permissions so much easier to manage at scale.
The key principle here is separating databases from user pages.
This makes the databases harder to delete by accident and allows us to give permissions to new team members much faster.
How the Sales to Delivery Pipeline Actually Works
Let's start with sales because this is where customers first enter your system.
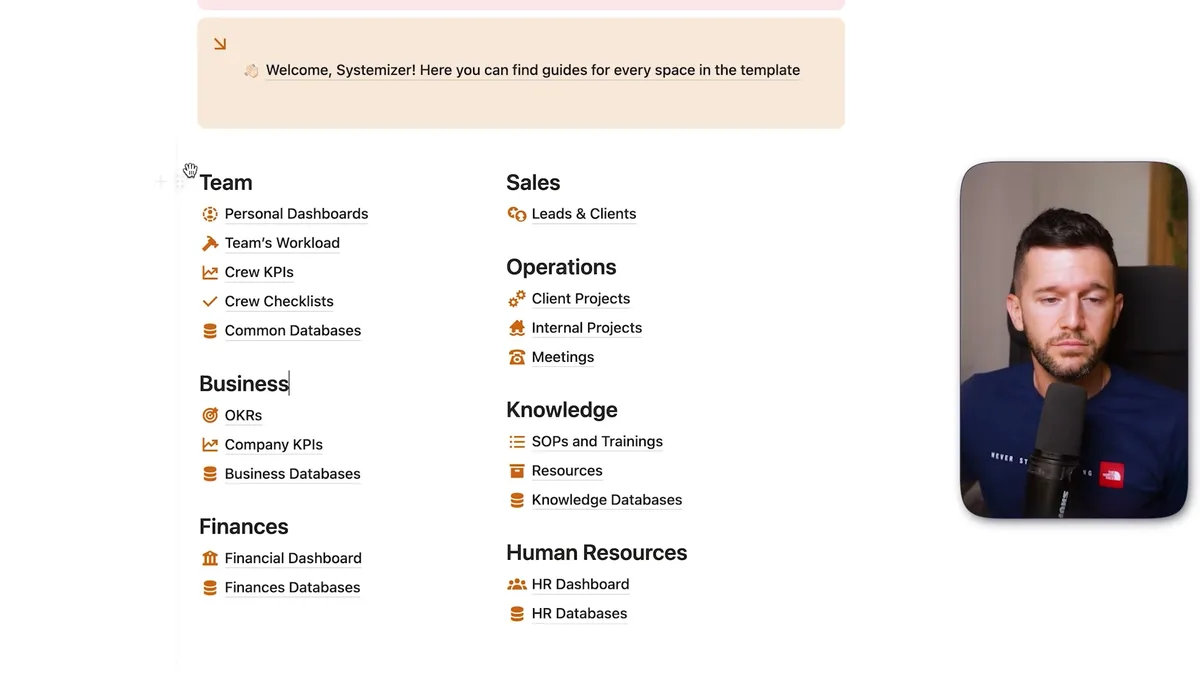
We have a space called Leads and Clients.
In the leads area, you can see all the different statuses leads go through.
For example, "payment link sent" or "contract waiting to be signed."
Whoever uses this system can rename these statuses to match their process.
The idea is that whenever we get a new lead, either manually or through automation, the lead information comes over here.
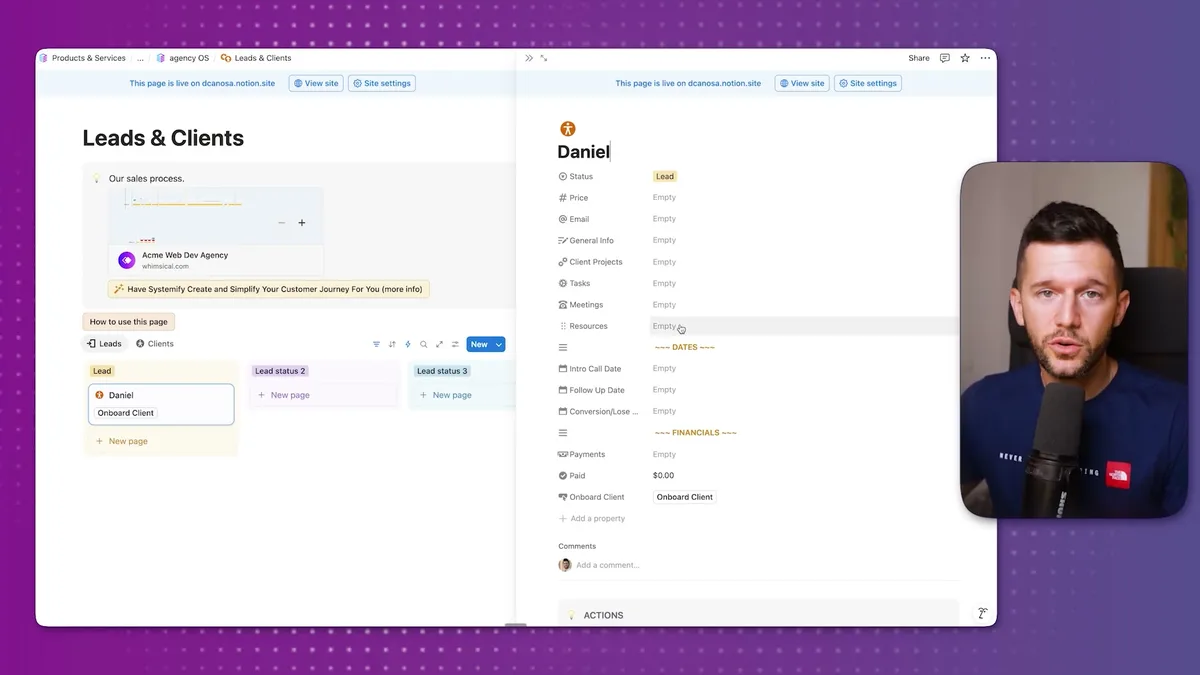
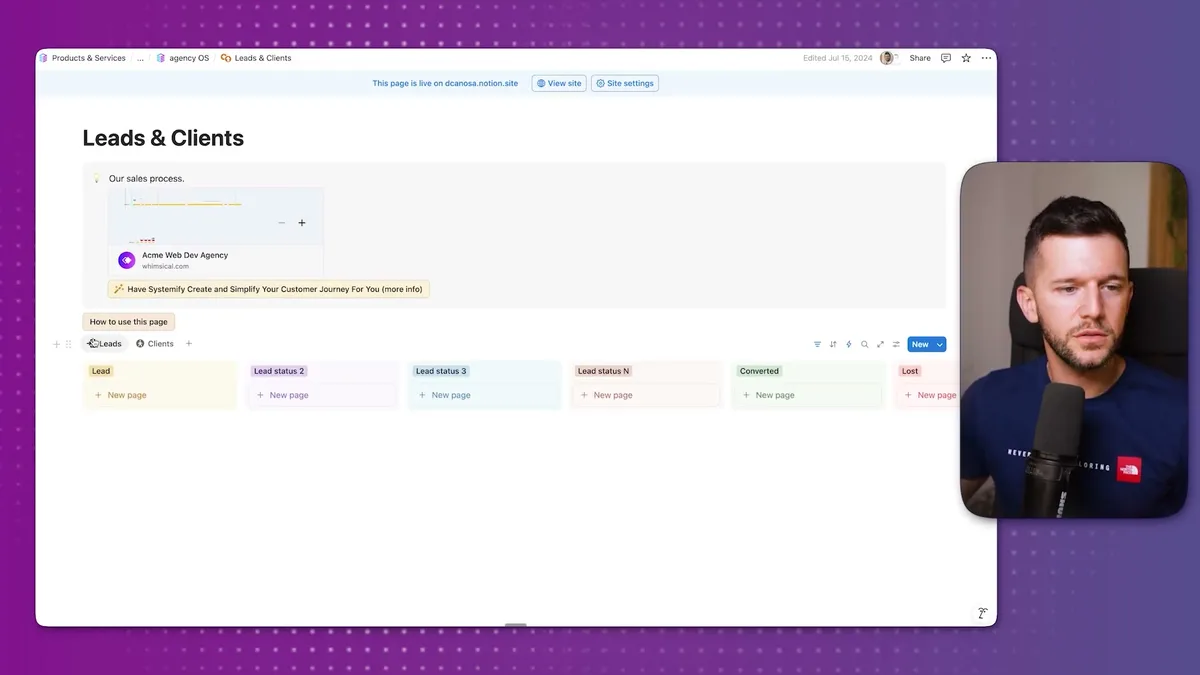
When we open a lead's page, we have a place to store everything about this particular person.
The price of the service we're offering, their email, general information we collected when they booked the sales call.
Future client projects we'll have with them, different tasks related to this client, all meetings we've had, all resources they've shared with us.
This becomes the single source of truth for this lead.
Once a lead converts, they move to the clients page.
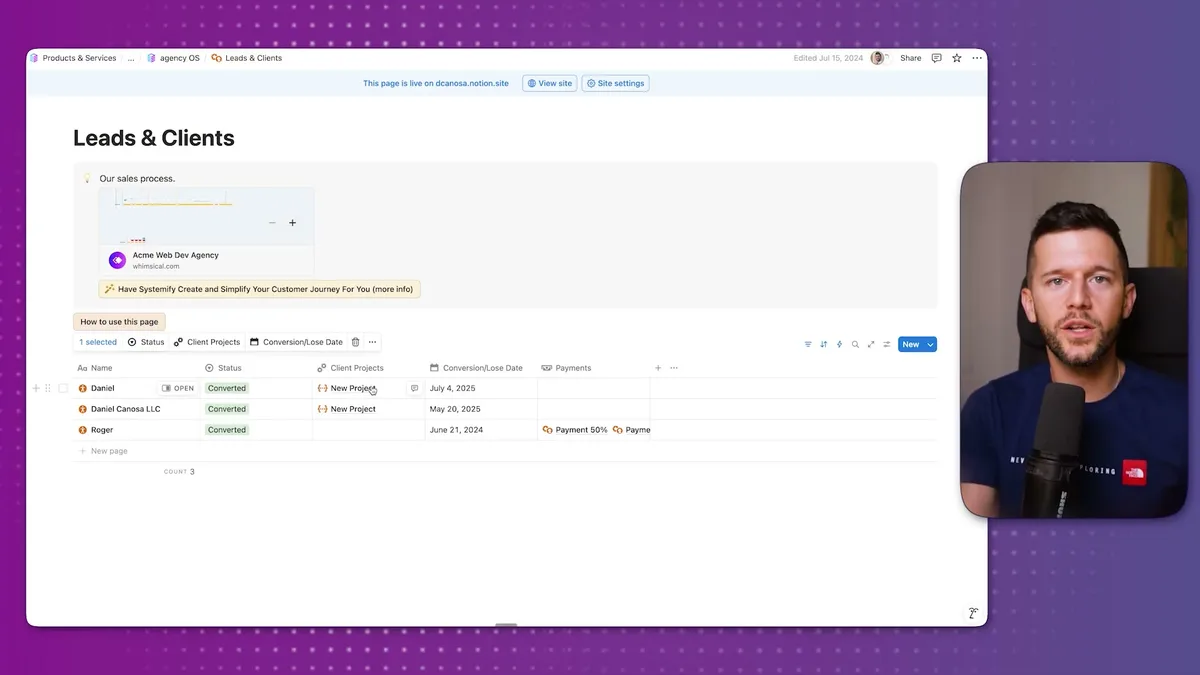
An automation logs the conversion date and creates a client project automatically.
I separate leads and clients from their projects because one client can have multiple projects.
Maybe they start with a Notion refresh, then want an AI automation project later.
This gives us flexibility of having one client with multiple projects.
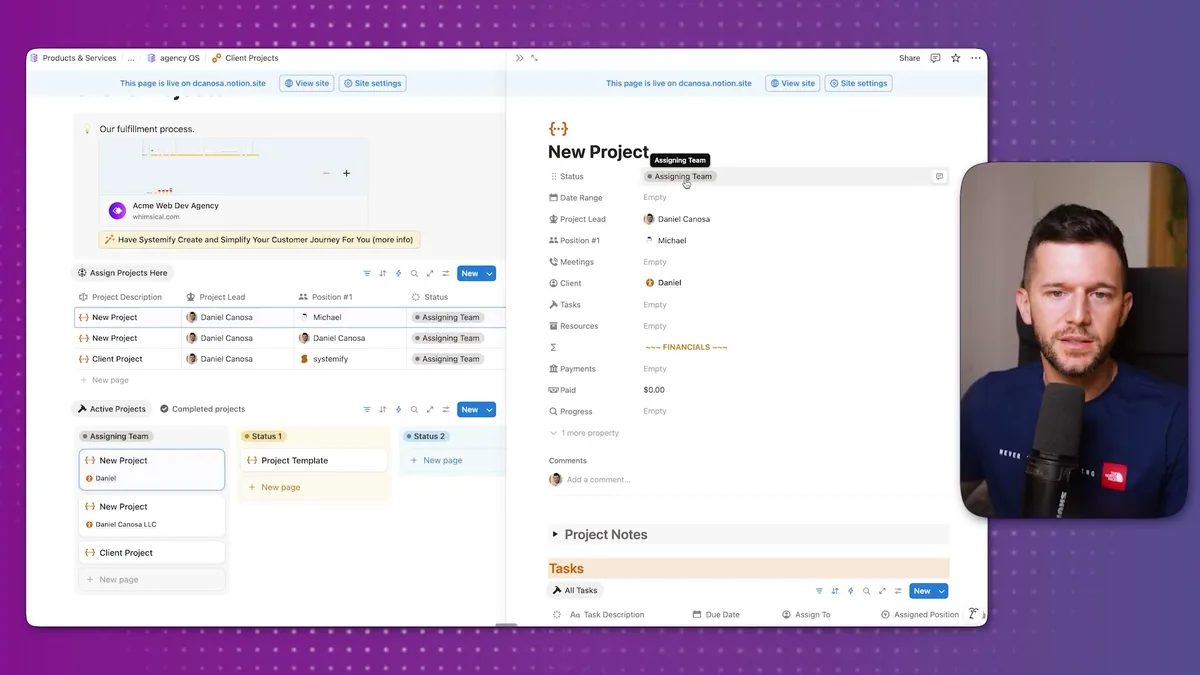
In the client projects dashboard, we can assign who does what.
In my company, we have a strategist who audits operations and creates a development roadmap.
Then a developer who builds the solution.
When we click on the project itself, we see the status, date range, all meetings related to this project, all tasks, all resources, and financials.
This page becomes the single source of truth for this particular project.
One of the main mistakes I see in companies is having information everywhere.
Google Docs, Google Drive, Dropbox, some stuff in Slack.
The purpose of using Notion is having all information in one place.
Here we can have all tasks, all meetings, all resources the client shared or we created for them.
Our team members don't spend time hunting for information about a project because it's always in this project page.
Now, here's where it gets interesting.
If you've streamlined how you deliver services, meaning you always follow the same steps in the same order, we can automate task creation.
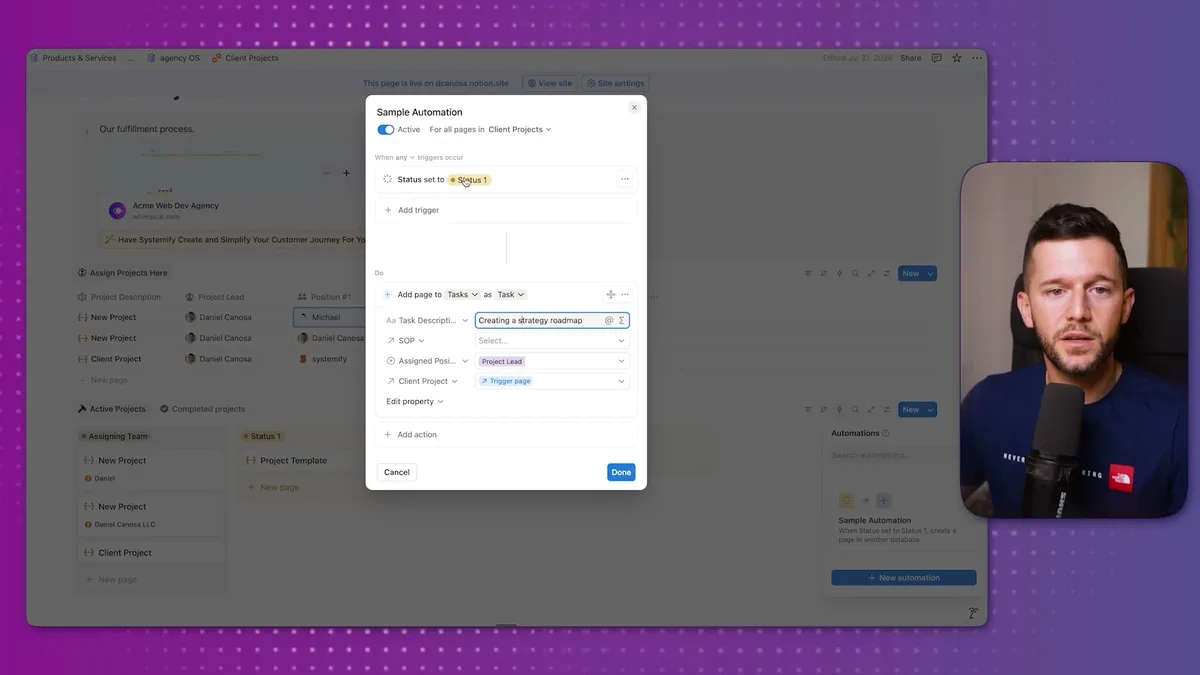
Whenever a project status changes, we can automatically create tasks for that status.
Let's say the first thing we do is create a strategy roadmap.
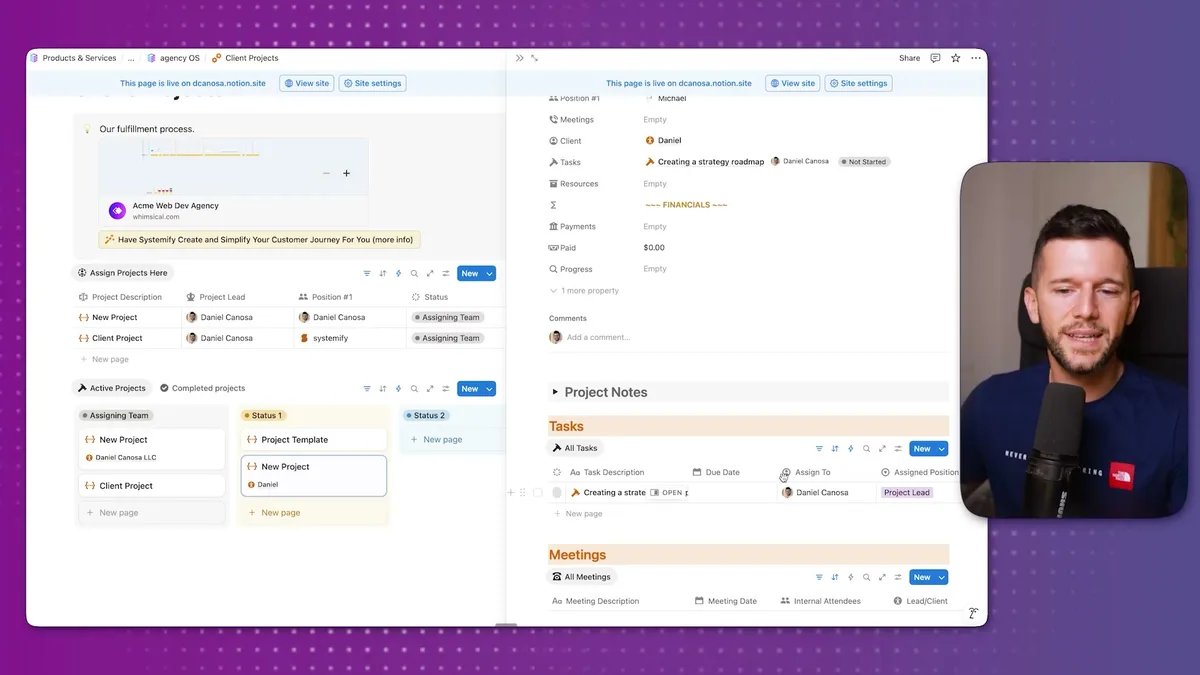
When the status moves to this stage, a "create strategy roadmap" task gets created and linked to the project.
But here's the really cool part.
We can link this task to an SOP that explains exactly how to do it.
So when someone receives this task, they also get the documentation explaining how to complete it.
They probably won't ask you anything because they have everything they need.
Since we have assigned positions and project leads, the task gets automatically assigned to whoever the project lead is using a simple formula.
This provides an incredibly flexible way of delivering projects.
If you automate all task creation and define who covers each position, all tasks get created automatically, assigned to the right person, with the SOP attached.
You're basically out of the operations if you have the right team.
You don't have to keep telling people what to do at which stage because the system does it for you.
How Teams Use This System Daily (And How You Stay in Control)
So how does Daniel know he needs to do this task?
Two ways: he gets a notification, and he has a personal dashboard.
Personal dashboards have two spaces: one for tasks, one for projects.
This is where team members go daily to understand what they need to do.
In unscheduled tasks, they see new assignments like "create strategy roadmap."
As I mentioned, the SOP is attached right there.
The only thing they do is schedule the task.
Then they use the calendar view to see all tasks visually, or the "today and overdue" view to see what needs to be done today.
When they start working, they move it to "in progress."
When complete, they mark it "completed."
There's a filter hiding completed tasks because this view should only show what needs to be done.
If you want to see what's been done, there's a separate view with completion dates automatically logged.
This gives you a record of everything your team accomplished and when.
But as a founder, how do you know what everyone's working on?
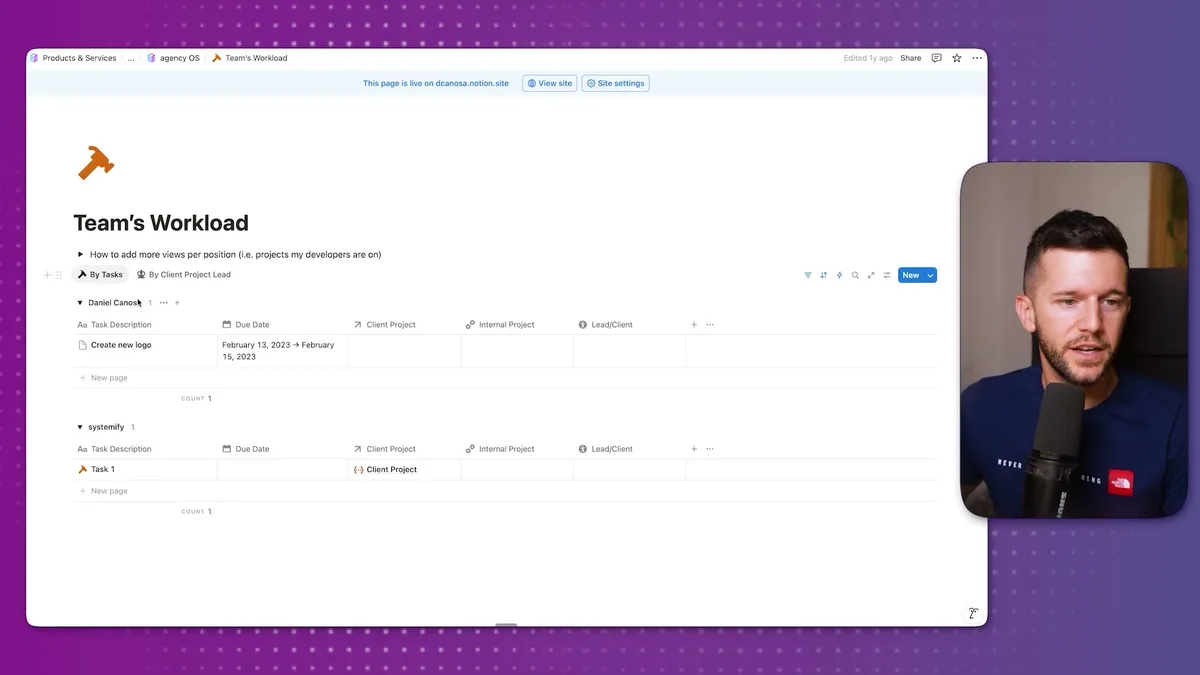
We have a team workload view.
Here you can see Daniel is pending to create a new logo, someone else has different tasks.
You can see everyone's workload before assigning new work.
If you want to give Daniel something else, check his workload first, then decide whether to give it to him or someone with less on their plate.
We also have a graph view that's more visual.
You can see Michael has three tasks, Daniel has one, and six tasks are unassigned.
Click on unassigned to see which tasks need owners.
This gives you complete oversight of what people are working on without micromanaging.
Now let's talk about money.
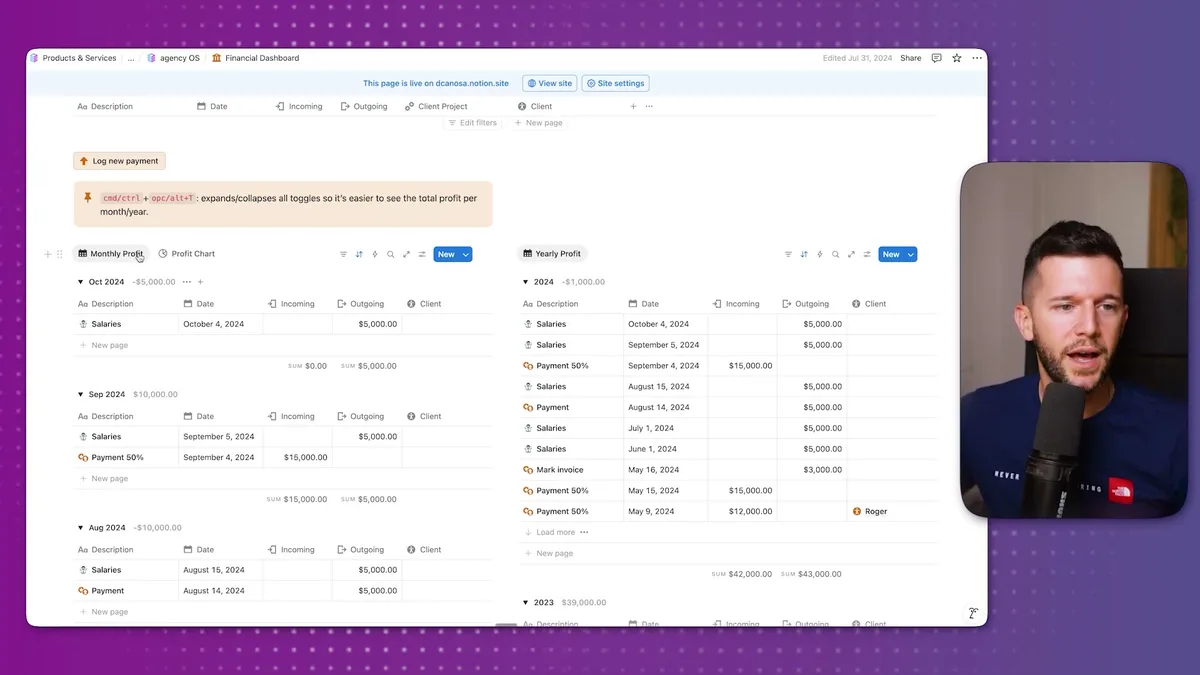
The financial dashboard is simple: log all financial transactions in the company.
You can automate this so bank transactions flow directly here.
We have yearly profit view (separated by year) and monthly profit view (separated by month).
Every transaction is incoming or outgoing.
The system calculates the difference automatically.
For client payments, let's say your client pays $5,000 but splits it into two $2,500 payments.
Your automation or you manually create the payment entry: incoming $2,500, linked to the client project and client.
This $2,500 appears in financials, and when you view the client's page, you see how much they've paid.
Of course, good financials are the result of doing good business.
But how do we know we're doing good business?
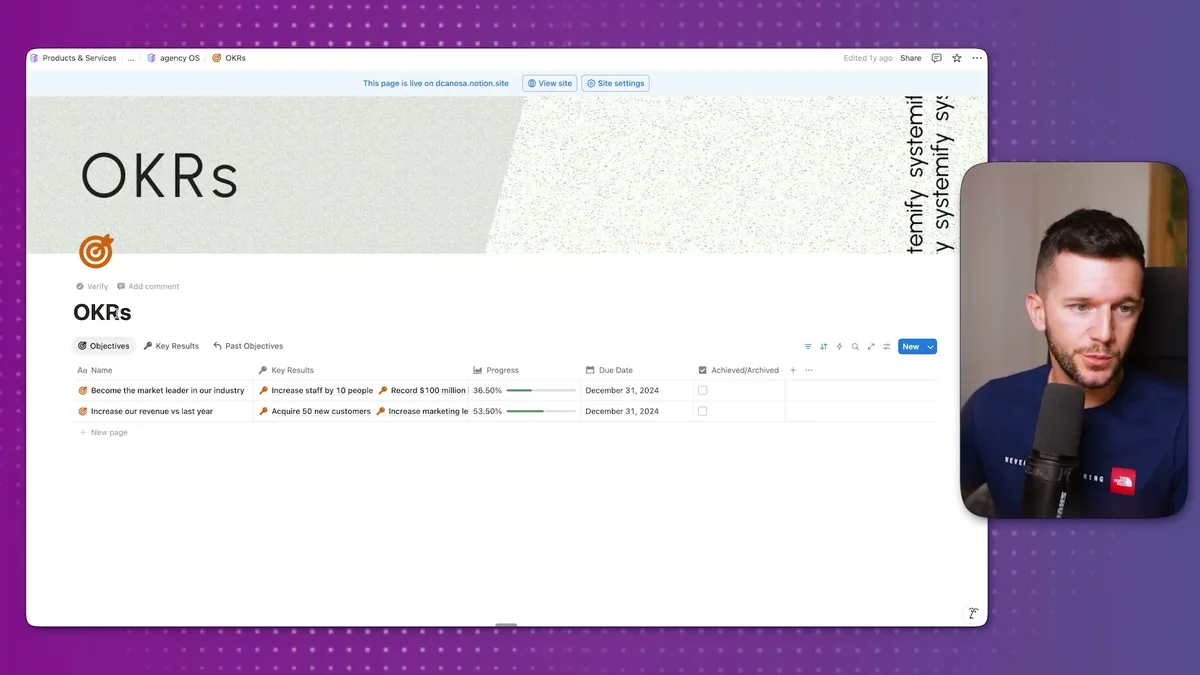
We track this through OKRs (Objectives and Key Results).
Here we can set company objectives like increasing staff, hitting revenue targets, or acquiring more customers.
Each objective has measurable key results with target dates.
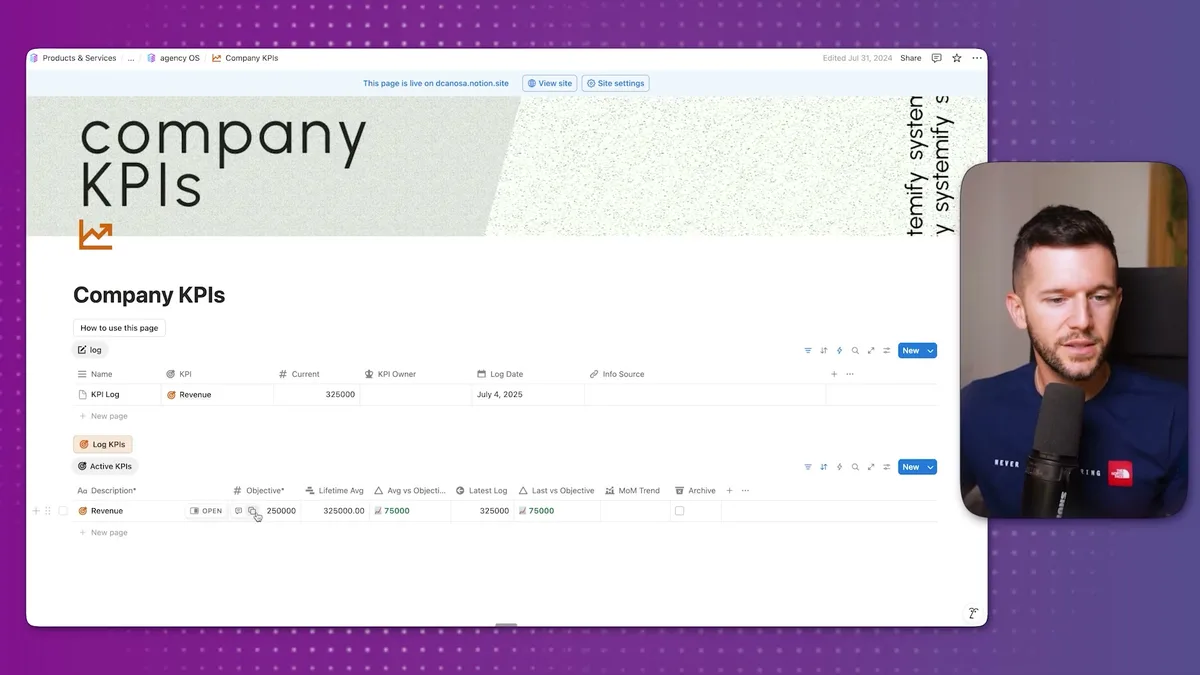
We also have KPIs (Key Performance Indicators) that show company-wide metrics and individual team member performance.
This gives us both the high-level company health and individual accountability.
For growing teams, we have HR workflows built in.
The HR dashboard manages hiring processes and candidate tracking with automations.
When you're ready to hire, the system guides you through each step consistently.
Finally, everything connects back to your knowledge base.
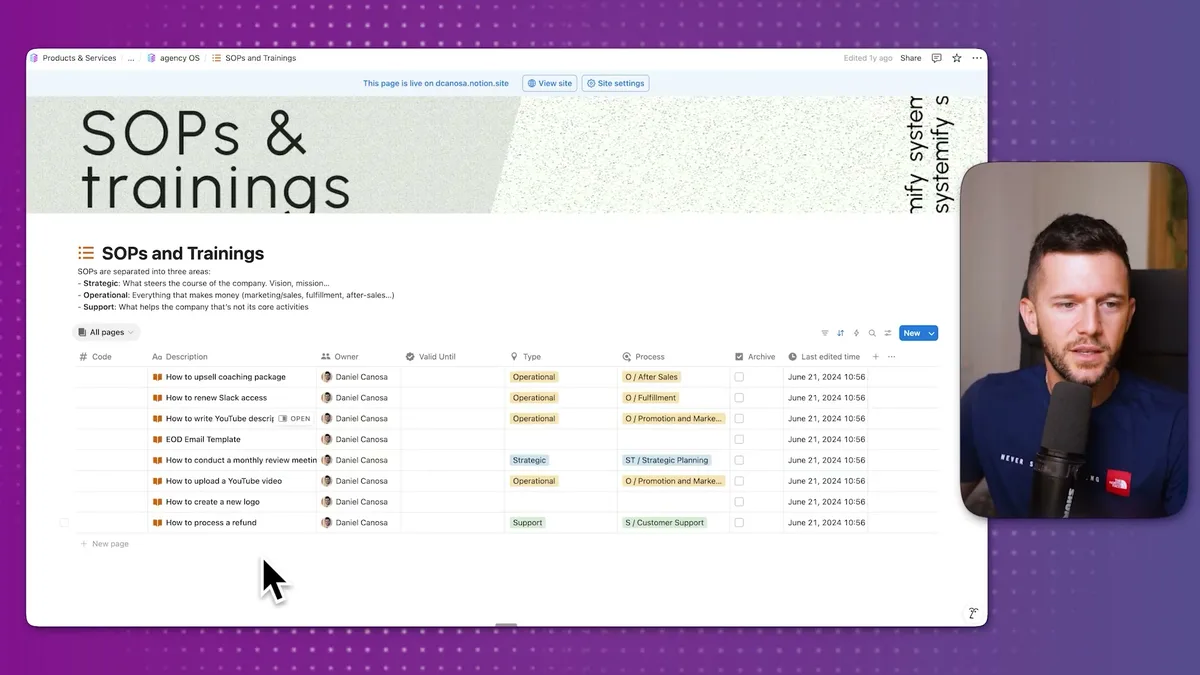
The SOPs and Trainings database stores all your procedures organized by type, owner, and category.
When tasks get created automatically, they link to the relevant SOP so your team always knows how to complete them.
This is the foundation that makes everything else work.
Bear in mind, this system is designed for service businesses that want to scale without the founder being involved in every single operation.
The magic happens when tasks create themselves, assign themselves to the right people, and come with instructions attached.
Your job shifts from doing everything to building the system that does everything.
And honestly, that's how you build a business that can grow without breaking you.
Ready to see where your business stands with AI and automation? Take our AI Readiness Scorecard to find out.
Frequently Asked Questions
How many databases does a scaling business need in Notion?
This system uses 13 databases to cover sales, operations, finances, knowledge management, and HR. Three years ago it used 18, but experience showed what actually matters in day-to-day operations. Start with the essentials and only add databases when you have a clear need for them.
Can Notion automations really replace manual task delegation?
Yes, for standardized service delivery. When your project follows predictable stages, automations can create tasks at each status change, assign them to the right team member using formulas, and attach the relevant SOP. The founder only needs to intervene for exceptions or decisions that fall outside the standard process.
What is the difference between separating databases from user pages in Notion?
Databases hold your raw business data (clients, tasks, finances), while user pages are filtered views that team members interact with daily. Keeping them separate prevents accidental deletion, makes permissions easier to manage when onboarding new hires, and keeps the workspace organized as it grows.
Get more like this in your inbox
AI implementation insights for service business founders. No fluff.